
Project Phases Diagram | Communicating Visually to Save Time
Often, when I describe what we do at 6R, I say “we speak conversational tech,” and somehow people know what I mean by this.
We are not IT people, but rather business people who have learned how to converse with IT.
The technology component of everything we do has become so intermeshed with our everyday lives that IT and the processes that support it have become incredibly important, but nothing is more important than communicating clearly and quickly.
We find that Being Able to Communicate With Diagrams is Incredibly Helpful and Has Saved Hours of time in Projects.

NEVER underestimate the value of a good diagram. In fact, I think you can tell if a diagram has been successful by how far it travels.
I have been lucky enough to have some of my diagrams presented back to me over the years in project briefings, which is always a great endorsement for the content.
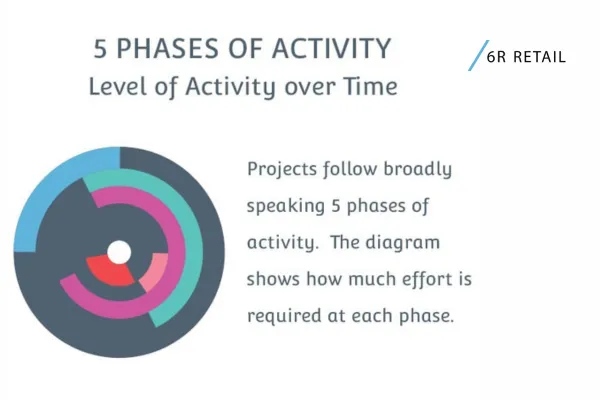
When trying to explain project phases and structures to a business team, it’s important to have something that maps out the process from end to end (or in this case, a circle).
The people that we deal with are usually visual people.
This diagram is adapted from traditional project phase and activity methods and shows the effort in line with the different phases of the project. Would this one work in your business?
Retail improvement, made practical.
Leadership thinking that drives change.
Sign up to receive new articles and strategic guidance.
